ABC classification

What is ABC classification?
ABC classification is a ranking system for identifying and grouping items in terms of how useful they are for achieving business goals.
The system requires grouping things into three categories:
- A -- extremely important.
- B -- moderately important.
- C -- relatively unimportant.
ABC classification, also called ABC analysis, is usually associated with inventory control, although it can also be used to rank business segments. For example, an organization might use ABC classification to identify its most valuable customers, investments with the highest financial risks, or inefficient processes that should come into greater business process management focus.
ABC classification is based on the Pareto principle, which maintains that 80% of a system's outcomes are determined by 20% of its inputs. The Pareto principle, often called the 80/20 rule, is more simply expressed as the idea that a minority of inputs results in the majority of outputs.
ABC classification does not adhere strictly to the 80/20 breakdown. It does, however, provide organizations with a methodology for identifying their most valuable business segments so they can control them more closely. After identifying the A, B and C categories, they can manage them in a different way, with more attention devoted to category A, less to B, and even less to C.
ABC classification and inventory management
In inventory management, ABC classification helps organizations better focus their resources on the most important items. Without a classification system, all inventory is treated the same, which makes inventory management less efficient and can result in a stock surplus or shortage.
By using the ABC method, organizations can categorize their products in specific ways and then prioritize certain items based on whichever approach they've selected. For example, they can group their inventory by profit margin, sales revenue or product cost, and then prioritize a subset of the inventory based on the chosen breakdown.
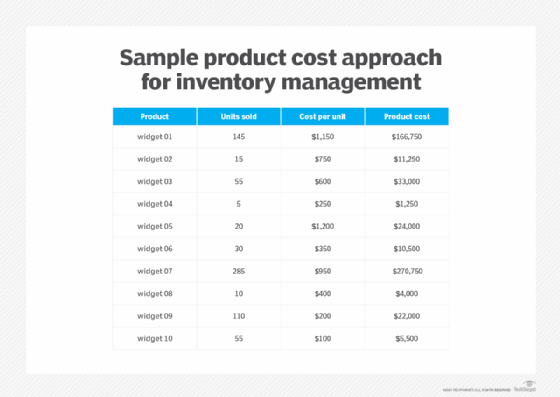
Product cost is among the most common approaches to ABC inventory management. In this scenario, sort products based on the total cost of each over a specified time. For the calculation, multiply the number of items sold within that period by the total cost per item. A product's cost should reflect all expenses, including production, transportation and storage.
If a company sells 145 widgets in a year and each costs $1,150, the total cost for that product is $166,750 for the year. Figure 2 shows total annual costs for 10 widget products.
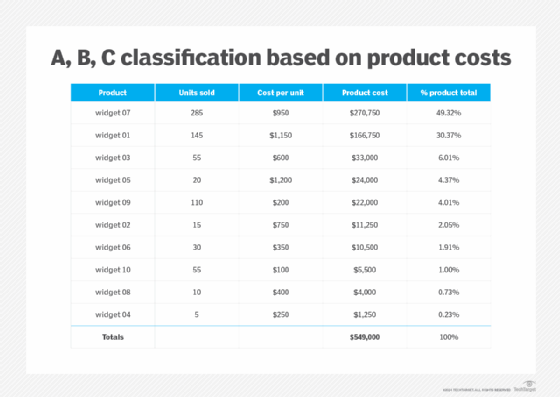
The next step is to sort the products in descending order of costs to easily identify the top products. Then add those costs together to generate the total and determine the percentage of the total costs attributable to each product. Figure 3 shows these steps applied to the data in Figure 2. To determine each product's percentage of the total cost, divide the individual product cost by the total product cost. For example, the product cost for widget 07 is $270,750. Divide this amount by the total cost, $549,000, to get 49.32%.
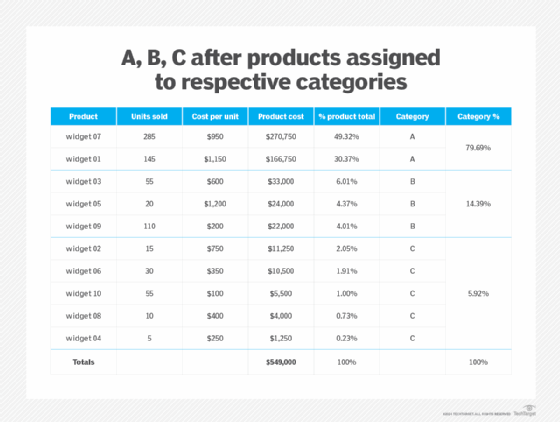
After calculating the product cost percentages, use this information to group the products into the A, B and C categories. The method for categorizing the products will vary from one situation to the next. One common approach is to assign the products that represent 80% of the costs to category A, the middle 15% to category B and the bottom 5% to category C. However, these percentages are just guidelines. Companies can vary the percentages according to their own requirements and inventory.
Figure 4 shows the result after the products were assigned to categories. The top two products, widgets 07 and 01, represent 79.69% of the total costs, so those are in category A. The next three products, which represent 14.49% of the total costs, fall in category B. The remaining products fall into category C, which comes to only 5.92% of the total costs.
Once products are categorized, design an inventory strategy with these categories as a guideline. This approach can help to better forecast and organize inventory and prioritize efforts. It can also help companies manage their warehouse more efficiently and improve customer service. Rather than treat all products the same, they'll know where to invest the greatest amount of time and resources in terms of planning, monitoring and controlling inventory.
ABC classification with XYZ analysis
Although ABC classification is a relatively straightforward way to classify inventory, it is often considered overly simplistic and at times too rigid. The ABC method can make it difficult to accommodate new products, unexpected buying trends, seasonal fluctuations or other sales variabilities. For example, if widget 04 is a holiday-specific item, the organization might not be prepared for the sudden rush of sales when that holiday approaches because it falls into category C, the lowest priority.
To help overcome these issues, some organizations use ABC classification in conjunction with other systems. For instance, the ABC method is often used along with XYZ analysis, which classifies products based on demand variability rather than on a metric such as product costs.
In XYZ analysis, the X category includes products with little demand variability, so they're considered the most stable. The Y category includes those that fluctuate in a somewhat predictable manner, such as seasonal or holiday products. The rest fall into category Z, which includes the most unpredictable products with the highest demand variability.
By using the ABC and XYZ analysis together, an organization can categorize its products more precisely. For example, widget 04 might now be classified as CY, rather than just C. CY products can be managed differently from the other C products, making it easier to accommodate seasonal fluctuations.
Learn about 20 common problems with inventory management and how to prevent them.